
Power BI/Power Query/M series
Chapter 3
Any two weeks comparison of plans
a sample-like jump pick comparison metric (difference in plan total for the week) – to compare what had been planned in any two weeks. The rest of the project (on the dashboard) contains conventional elements, premises.
***
Dashboard brief:
We track a portfolio of projects, and need to compare the planned project cost in any two weeks – as a comparison. It sounds a bit choppy at first, as this is neither rolling period / average total (window) nor YTD, PYTD comparison. The objective of the task is to assess planning quality and how reasonable is the predictability of the total portfolio (cost side) in any two weeks, including last two. Our informed assumption is that certain events – acquisitions, budget exercises, results, competitive activity, new requirements all could be correlated to variability in planning, or ultimately the planning quality – e.g. large deviations between planned amount on comparable scope – projects, subsets etc. could be a pointer on what focus, and how important is the planning process.
Build-up:
Here we will again use the already familiar structure of (1) raw exports (ultimately excel files, weekly exports), then (2) analytic or preprocessing layer – combining and transforming raw exports into a flat file with just the necessary fields and finally (3) putting up the Power BI model, elements and visualization.
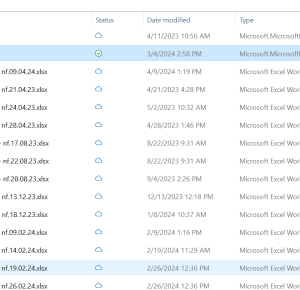
3-1 Data – export of weekly plan files in excel, weekly frequency
3-2 Processing exports into a flat file
3-3 Structure elements to support the dashboard as intended –
3-3-1 ranking of weeks to achieve Last On stack (without complex sorting and even if a week is missed) and then
3-3-2 the variables to reference the selected two weeks – for visualization of selection and filtering the visuals
3-4 Oversight and finishing touches
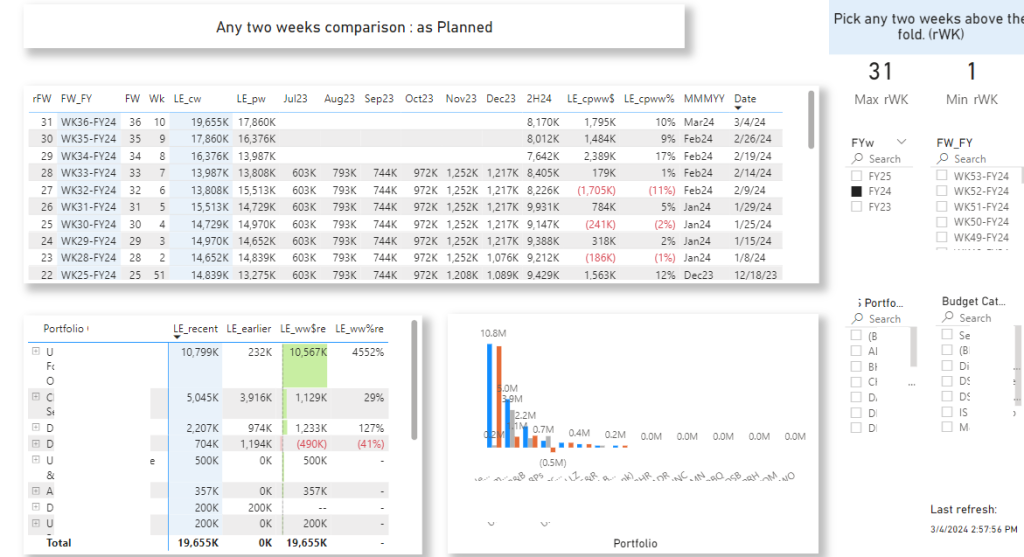
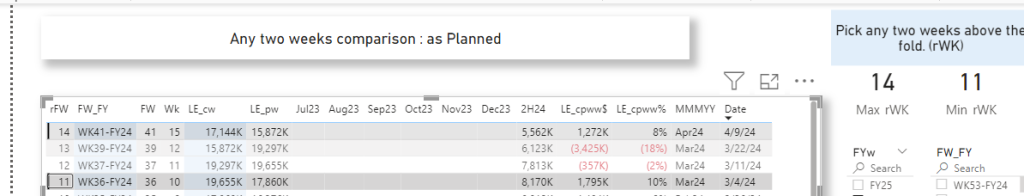
Default show-off – last available week – e.g. 31 to week 1
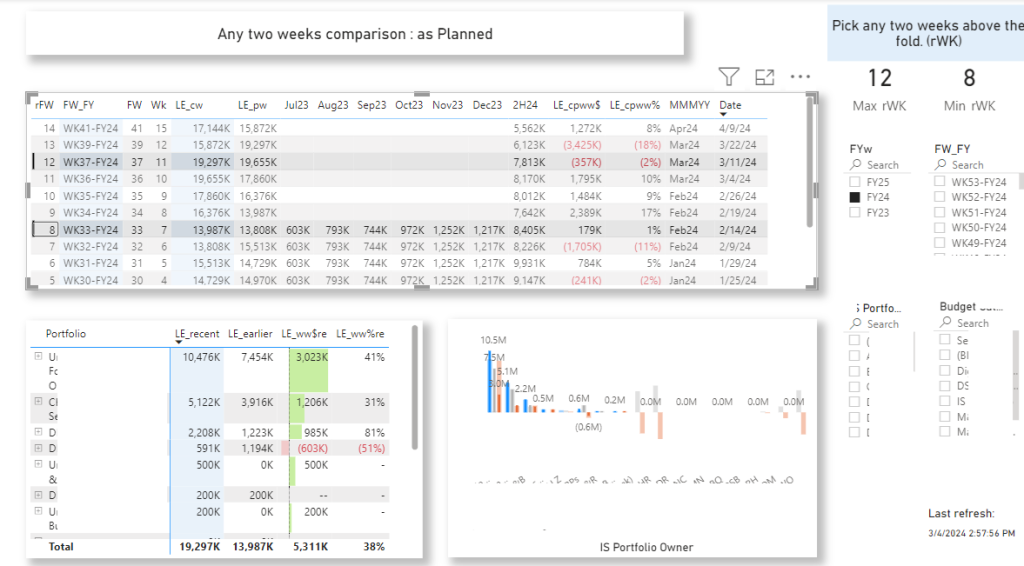
Target: e.g. pick weeks 12 and 8 and see how planned amounts have changed
*3-1 The data, weekly export files
*3-2 Processing exports into a flat file
We start a power query file to store and add the weekly exports into a flat table. The file takes the time, timestamp of the export file for the week – e.g. =WEEKNUM(..) and relates it in a common column as a week pointer
![]()
*
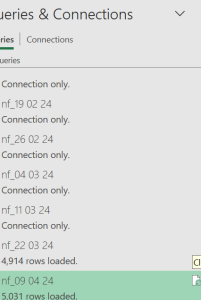
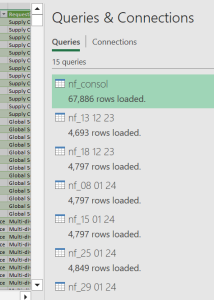
Exports are linked to the flat file as connections.
The consolidation query just adds every week to the cube:
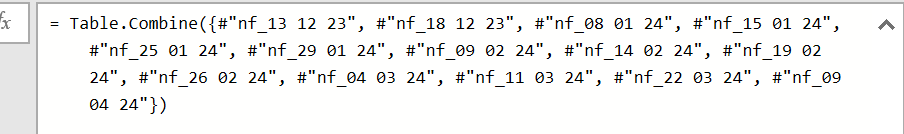
And the consol file is ready. The fringe benefit of this mode of working – the three layer – is that we can often cut a pivot table still on the preliminary steps to do the interim checks.
*
3-3 Structure elements to support the dashboard as intended –
3-3-1 ranking of weeks to achieve Last On stack (without complex sorting and even if a week is missed) and then
3-3-2 the variables to reference the selected two weeks – for visualization of selection and filtering the visuals.
Now the ‘Weeks’ part:
After tests and tears and checks and tries, and more tears ?, we stumbled on a working solution to combine a one new measure and a variable to it:
The rFW is for ranked Financial Week and it scripts with the DAX function:
![]()
(see also Introducing the RANK window function in DAX – SQLBI )
*
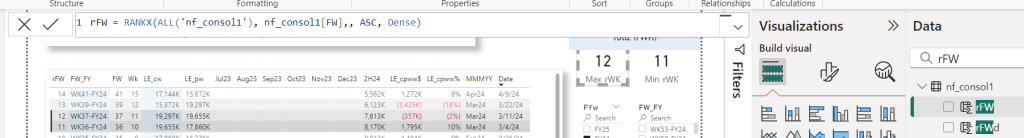
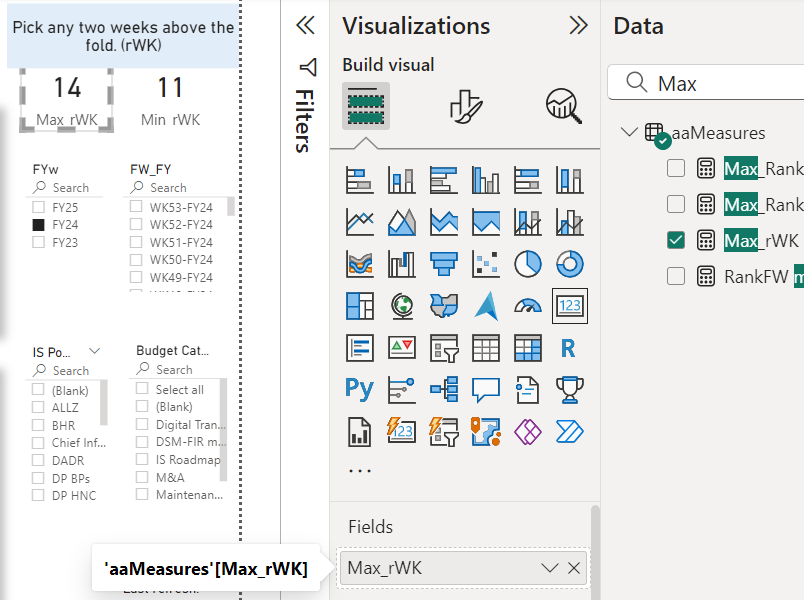
RANKX not only turned a well thought out function, but also it works surprisingly well as aide to the two other measures we’d create for the Min and Max weeks as selected on the ‘above the fold’ table:
e.g. 14 to 11 weeks in comparison as 14 is the Max rWK (max ranked week) and 11 is nothing other than the Min one.
*
Now the Min / Max weeks – derived from the Ranks by using a helper variable
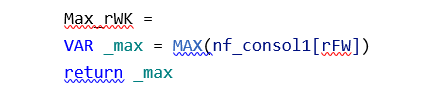
Max rWK:
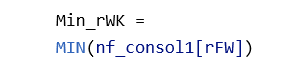
Min rWK:
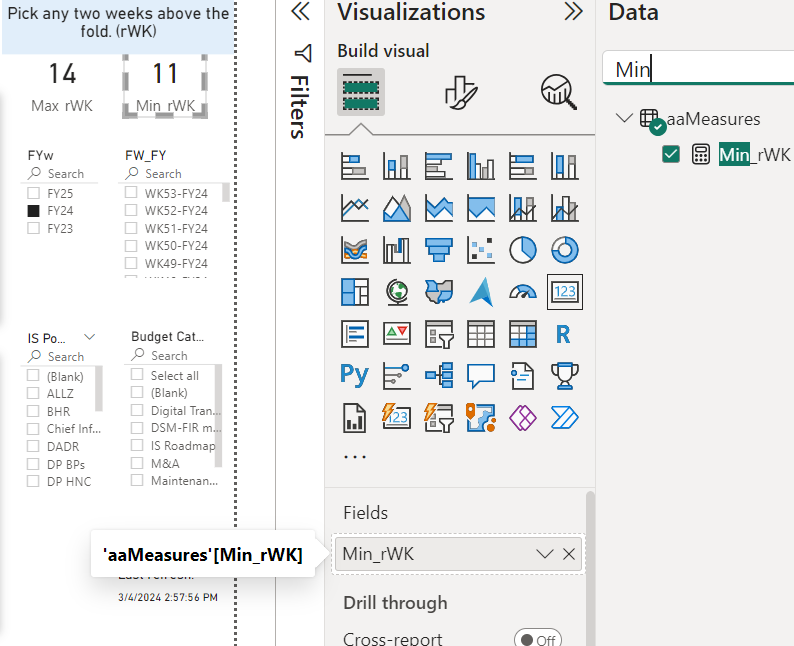
3-4 Oversight and finishing touches
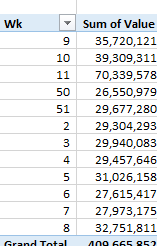
Now that the main table – the one that reviewers select the weeks to compare – cross filters the rest of the visuals – all report elements, look in sync.
For the calendar table, last refresh, cross filtering, quick measures, table and number formats you may want to check the sections of the Basic tools chapter (aka Baker’s dozen).
Comments are closed