
Power BI/Power Query/M series
Chapter 2
Power BI – Basic tools, tips, pre-sets – the Bakers dozen part 2 (4-7/12)
***
In this second part of the basic tools we will look at tables, numbers and order of numbers formatting, including dynamic formatting. In addition, let’s check out how slicers’ search is enabled and how links and cross filering between visuals and report elements in general are set. These details are not critical but useful to give a sense of ‘complete’-ness, and that finishing touches for table -like visuals and reports with multiple elements that link across. We will limit this section to the sequence of the steps only for each setting as all are fairly straightforward and self-explanatory.
1 Remove empty lines in table, matrix visuals
2 Dynamically format numbers
3 Enable search in a slicer (both desktop and web / service)
4 Enable, adjust cross filter between visuals, report elements.
Let’s have a look:
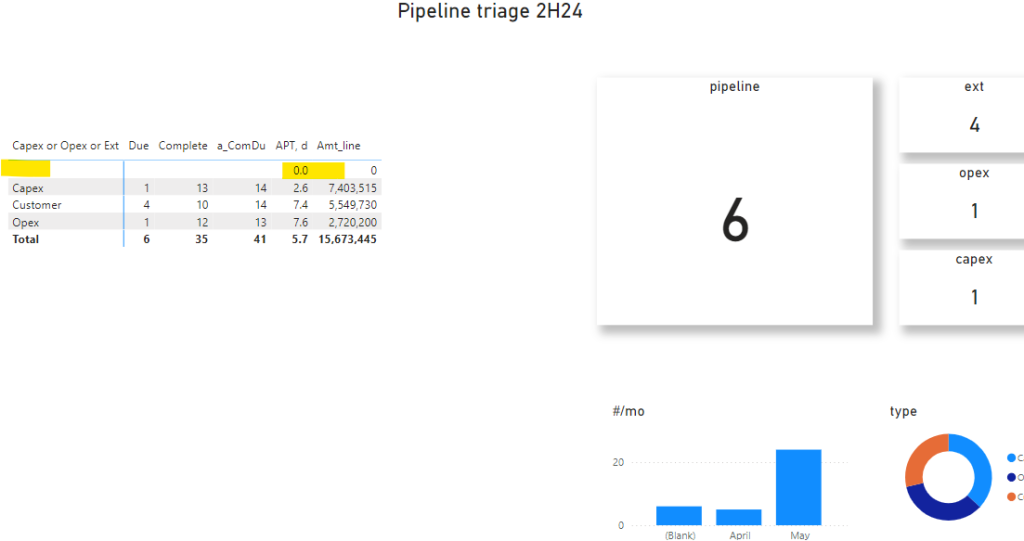
1 Remove empty lines in table, matrix visuals
We’ve just had a mock-up (aka MVP, POC) and it looks good, only it has this empty line, which makes it ready for Questions ? from the internal customer – is it an error, is there missing smth, do we expect smth more. This is the energizing environment the analyst needs to thrive in and often try to look around the corner. As most things PBI, we try this one without any scripting, that is with the setting and ribbons.
- Identify measure, col, var that gives the empty line
- Select visual (works for table and matrix)
- Filter out the empty line with the selector.
*
//
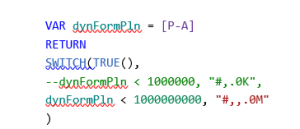
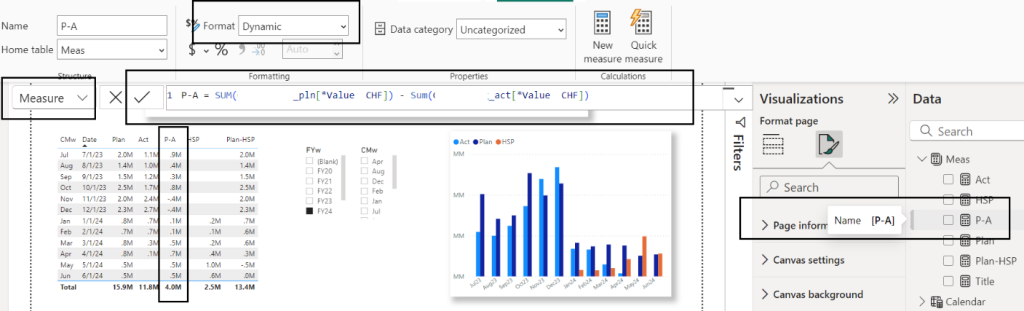
2 Dynamically format numbers
This workout is to align table column numbers to a couple significant digits, and a trailing order number – e.g. M(millions) K(thousands) etc. per the setting. Once aligned the table numbers, the whole table looks better, neater and easier on the eyes. Also the higher the ranking of the business users, the more likely it is that they focus on M only, which is now a quick reference still on the table.
2-1 go to the measure of interest (usually in the measures table, created in the previous chapter.. ? )
2-2 e.g. Select P-A (Plan – Actuals).
2-3 Set Format (on the ribbon) to Dynamic
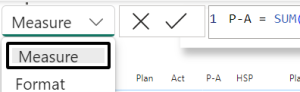
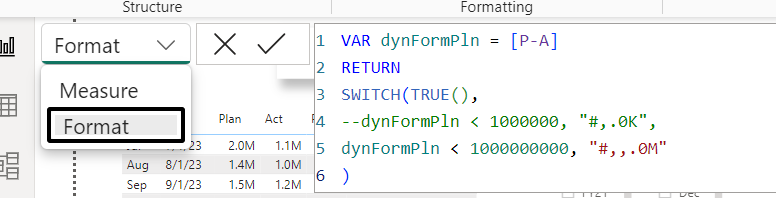
2-4 Switch Measure toggle (to the left of the formula bar) to Format
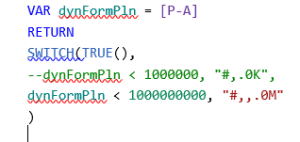
2-5 Set to VAR (Dynamic Format Variable) according to the desired order of amounts and format style:
e.g.
Now / after the Dynamic format of Measures (target format):
*2-2
*
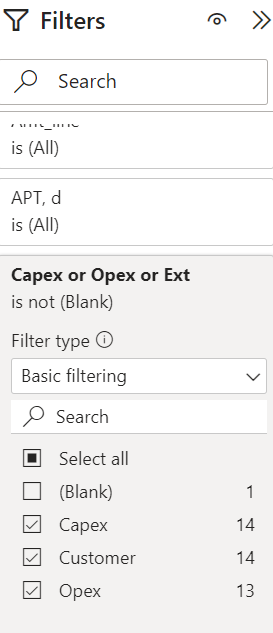
3 Enable search in a slicer, table (both desktop and web / service)
This pick is perhaps the most overlooked and has the potential to waste time the most, if not used. It is just a two clicks selection and works for both desktop and service (intranet / web)
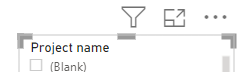
3-1 Starting from the non-enabled state of the slicer search:
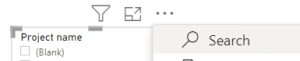
3-2 Elipsis (three dots) – Search
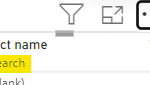
3-3 Enabled now
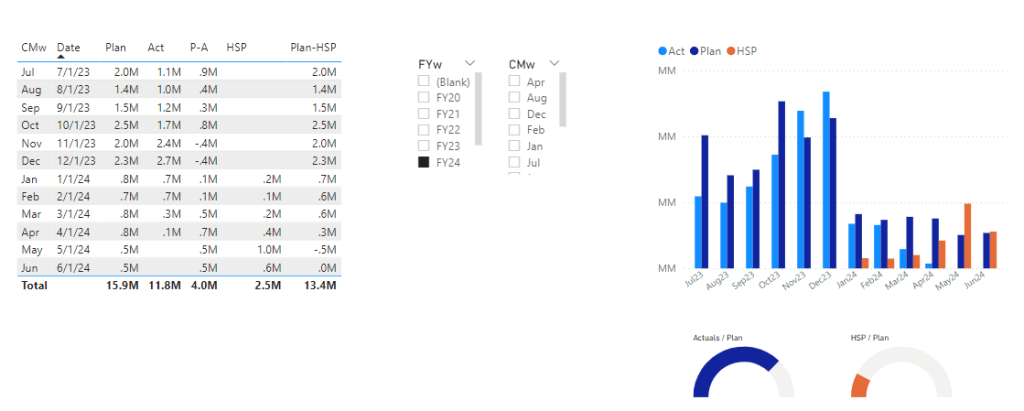
Slicers – enable / disable, adjust link, cross filtering to other visuals, report elements.
This setting is more of a design and conceptual thing than visual effect. It matters though as it enables detailed control of the presentation selections and then the directionality of the filtering (and cross filtering).
For practicality though, let’s look at how slicers can give as some upper hand in our dashboard design, control and behaviors.
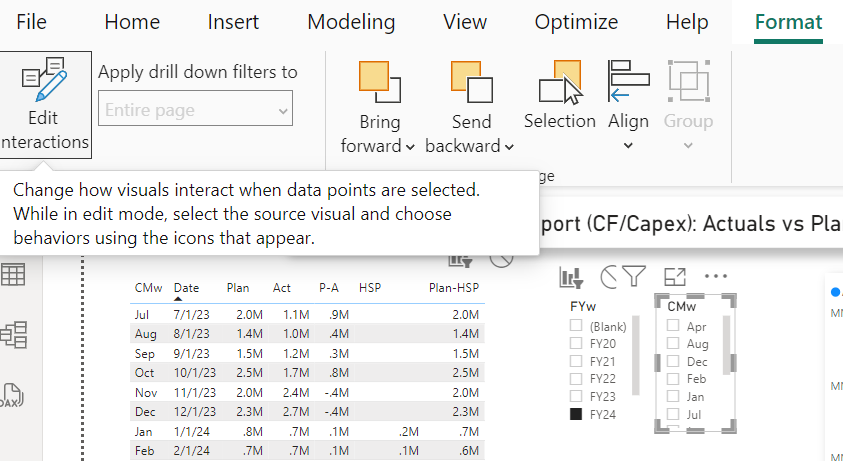
4-1 Go report page, (dashboard tab), select slicer to tune
4-2 Format (menu) Edit interactions (ribbon)
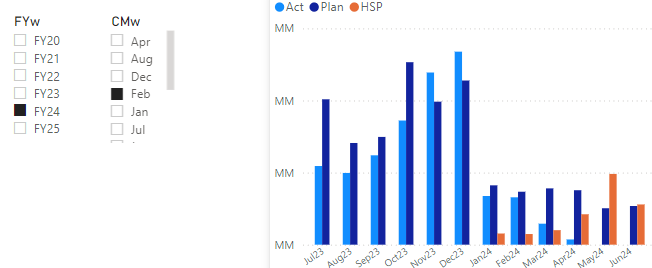
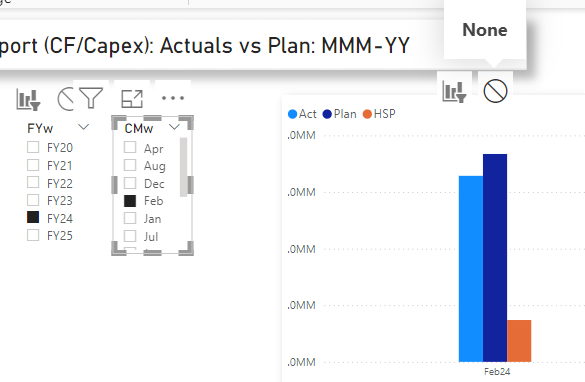
4-3 Select none (do not enter roadsign) on the barchart to the right
4-4 Now with Apr selected on the Month (CMw) slicer the bar is not cross-filterred (link is disabled)
Note, these quick cards are by no means exhaustive or comprehensive. You can find further, material, guidance on Power BI slicers, as most other topics Power BI on the learn.microsoft.com YT, specialized blogs, platforms.
see also: Slicers in Power BI – Power BI | Microsoft Learn
*4-1
Starting out – multiple all-out slicers:
*4-1
Starting out – multiple all-out slicers:
*4-3

*4-4
Comments are closed