
Power BI/Power Query/M series
Chapter 2
Power BI – Basic tools, tips, pre-sets – the Bakers dozen part 1 (3/12)
***
In the following article we will look at 12 basic tools, tips and settings, that we use in almost every report and that make our lives as analysts easier.
First three in this post:
1 Calendar table:
2 Last refresh
3 Measures table
1 Calendar table:
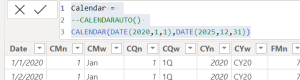
The Calendar table – or Date table – is an essential pre-set and reference. It is a query / column with all the dates for a specified period. Easiest way to create Calendar table is in DAX, by just a couple of lines, and also can be done via power query or third party plug-ins for PBI. Once the query column is done, various additional columns can be added so CT is used for different date, period transformations. CT also serves as a basis for the powerful group of the Time Intelligence functions, built in DAX, pq.
Another use of the CT is for giving structure and cross filtering, cross-reference link between tables with Time / Period dimension. This adds structure and enables filtering, slicers, i.e. period views. Remember, most of the utility value of the CT is derived from the data model: i.e. if/how it is being linked with the other tables, entities.
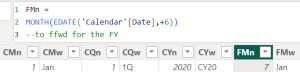
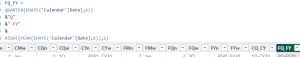
E.g. Fiscal year is offset (e.g. Jul-Jun), Reporting quarters are separated, Text combination for Qtr, Yr, Mo, H(alves) etc can be added.
*
Finally, mark the CT as calendar and check the locale settings if necessary.
//
2 Last refresh
If Calendar Table is the mandatory beginning, the Last refresh is the conventional finishing touch. Obviously a single date value (dt object) that stores the last update of the report.
Both PBI, pq
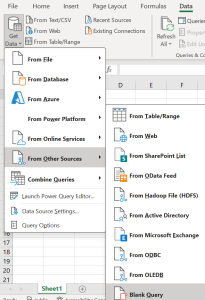
2.1 Get data
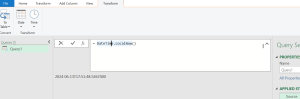
2.2 DataTime.LocalNow() // in editor
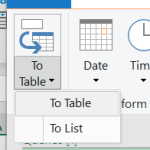
2.3 To table
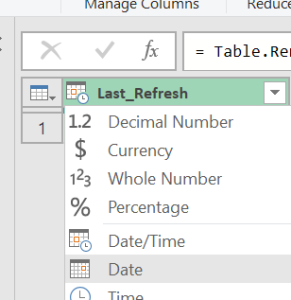
2.4 Format as intended, typeover the Title (Date/Short Date, etc.)
*
2.1
2.2
2.3
2.4
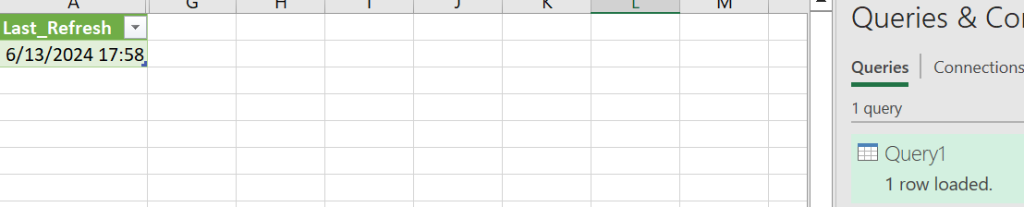
Ultimately – the last refresh can also be pegged in excel file:
//
3 Measures table:
This one is a handy housekeeping trick, which in time, and as measures of the dashboard grow in number and variability, offers a real time-saving, general order, readability, accessibility benefits:
The idea with the Measures table is to have all the measures of the model in a separate section. So it is created as an empty table with one column and then the table content – the column – is deleted, which marks the measures table apart.
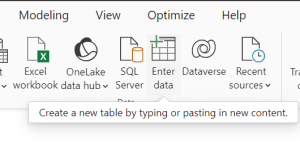
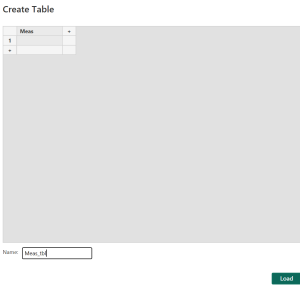
3.1 Enter data (no data will be entered in the table)
3.2 Give title to the only column (header) and Table name (bottom), then Load
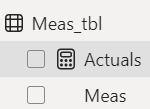
3.3 With the new Meas_tbl selected, create a new measure – smth simple like Actuls = Sum (..
3.4 Now with a measure already in the table (can tell apart by the calculator icon, thumb), delete the Meas (column) from the model
3.5 Now the measures table is also marked with the calculator (a handy visual pointer)
*3-1
*3-2
*3-3
//
Comments are closed