Power BI/Power Query/M series:
Chapter 1: A end-to-end data task in Power BI Desktop.
Scenario: Investment report – Actuals vs Plan by period and other details, slicers
***
Part 1 – The task brief
In this chapter we cover the task of reporting investment spend – actual vs planned – for a list of infrastructure projects over a selectable period.
NB: throughout the following Power BI materials and chapters, we will follow the three-layers framework for any data project: raw data, analytics (including processing) and presentation.
Practical tip 1:
Start with a rough target idea for the report – keep objective in mind while doing the data work. If necessary – sketch on paper or line up a very basic office document. Don’t overdo details at the beginning, as you may drift aside in unnecessary precision or vague search. There will be plenty of time at iterations and UAT.
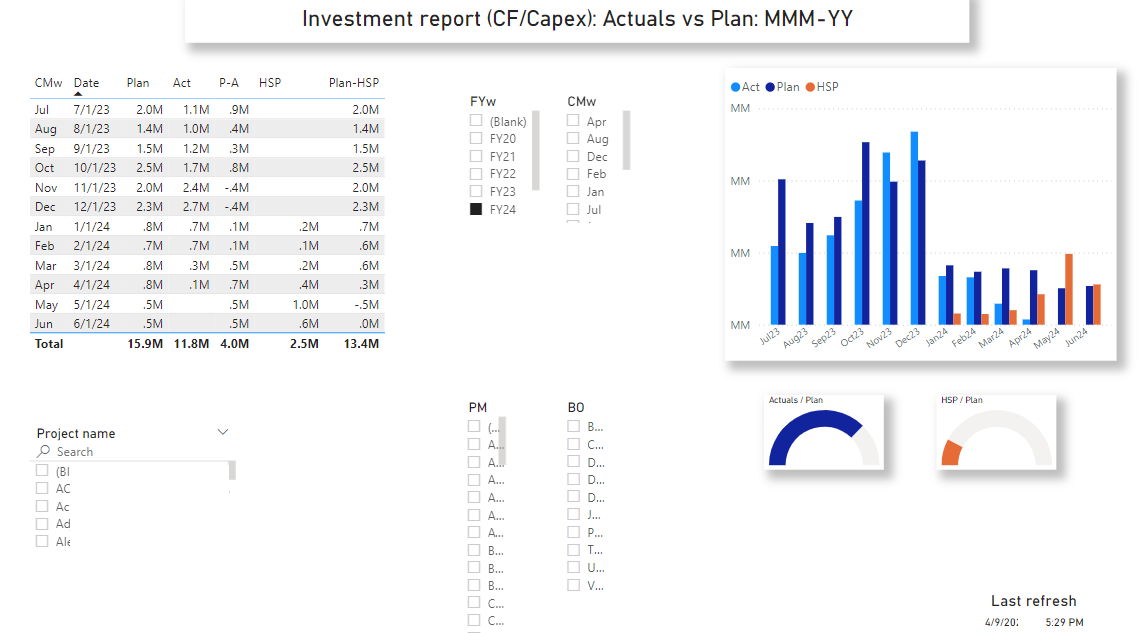
In our chapter case – we keep a simple vision of three sections – a tabular summary to the left, a bar and gauges visuals group to the right and slicers that we also use as separator – a graphic element and to leave space. This layout had been tested on multiple data projects with different audiences and it proved a worthy baselining variant.
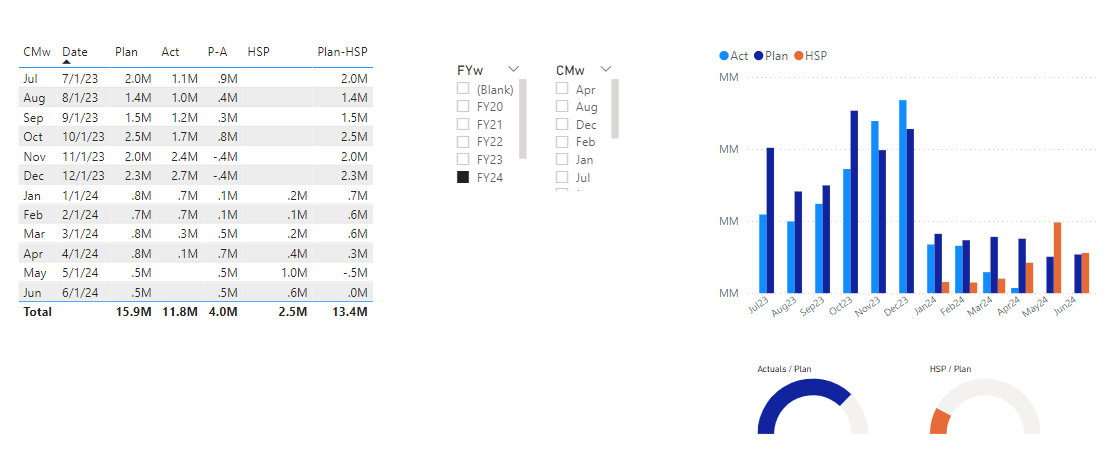
target_viz
Part 2
Data sources, workouts:
Actuals: A transactional table with order details and actuals (shared table, updated with every transaction – new order)
Plan: A monthly exports of the Plan/Budgeting system (a limitation).
Other: Auxiliary and enriching tables to enable different views, details and reporting subsets
(data model has data tables links)
The data work in two main steps:
Pre-process – an optional step to have data just about ready to work in power bi (power qry)
Get transform and load. (pbi)
Model and visualize (pbi)
2 Data:
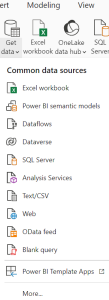
2-1 Get actuals – the transactional data – e.g. excel file
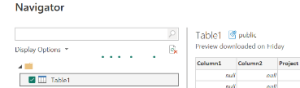
2-2 Navigate to the table, range, sheet of the file
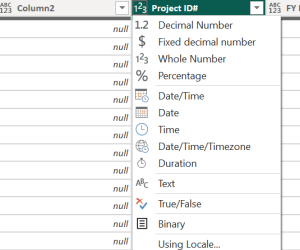
2-3 Transform – for now just set the data type of the columns that will stay (mostly numeric, text, date)
2-4 Get plan data – monthly exports as multiple files in a source folder – into a single consolidated table.
2-5 Load plan in pbi (similar to 2-1 .. 2-3)
2-6 Figure out the model. Have the correct links and relationships in place (but not more than what’s necessary).
As follows:
*2-1
*2-2
*2-3
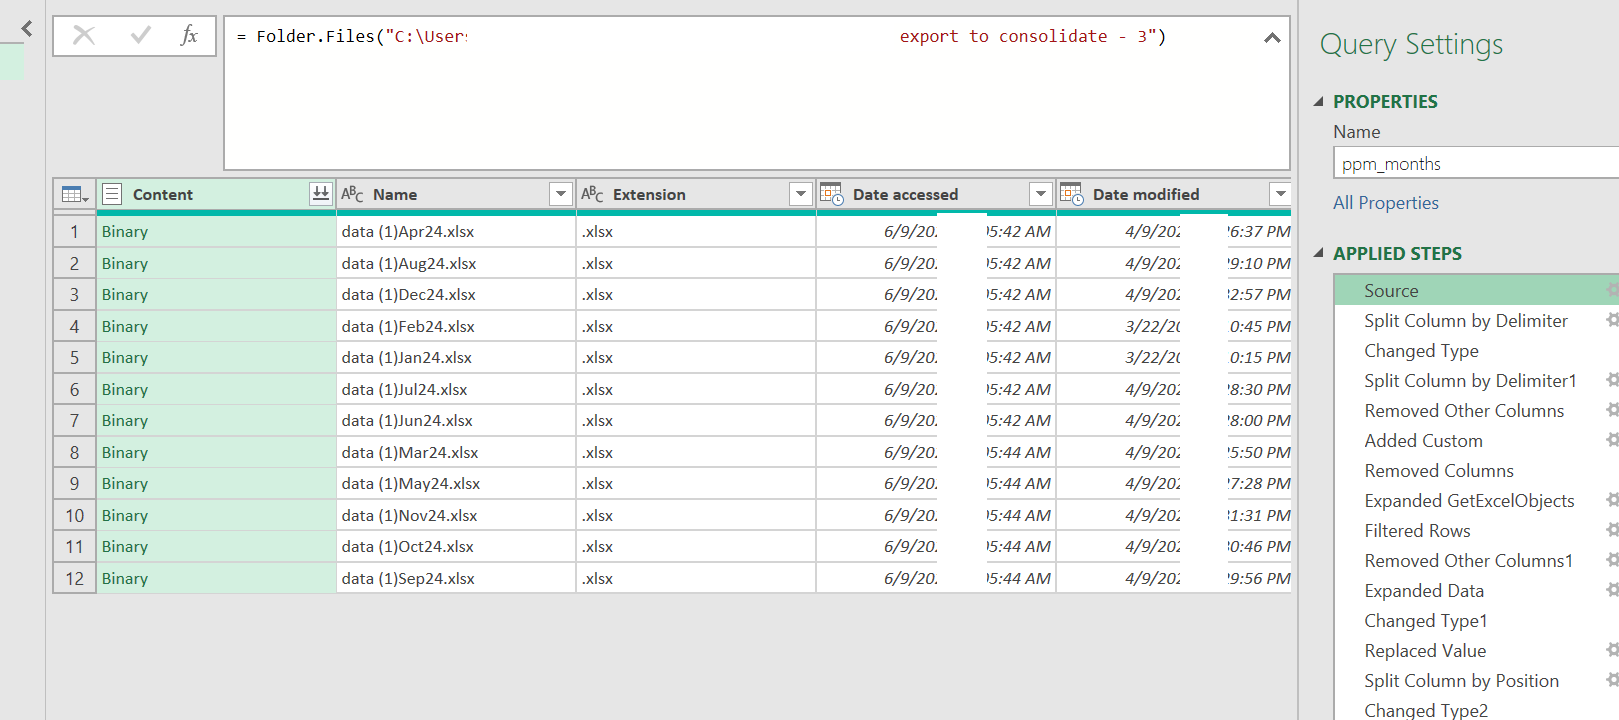
*2-4, *2-5:
We use this step as utility too – export files are usually named in a convention – e.g having a three letter month name in the file name. Now the file name is used to populate a Date/Month/Period column in the consolidated table. This column will be our period link to the rest of the data model.
NB: All files should be in the same folder – “..export to consolidate – ..” for the m-code to work. If not then use different queries / qry references to fetch the months and combine.
Now with all the necessary – and available – data all loaded into tables in pbi, we work out the model next: Dates and periods between tables are tied via the Calendar table, dimensions are loaded as standalone tables as we use them as slicers and last refresh and calendar bounds are added. For guidance on how to refresher on calendar, last refresh, etc/, please check the basic toolbox chapter (bakers dozen chapter).
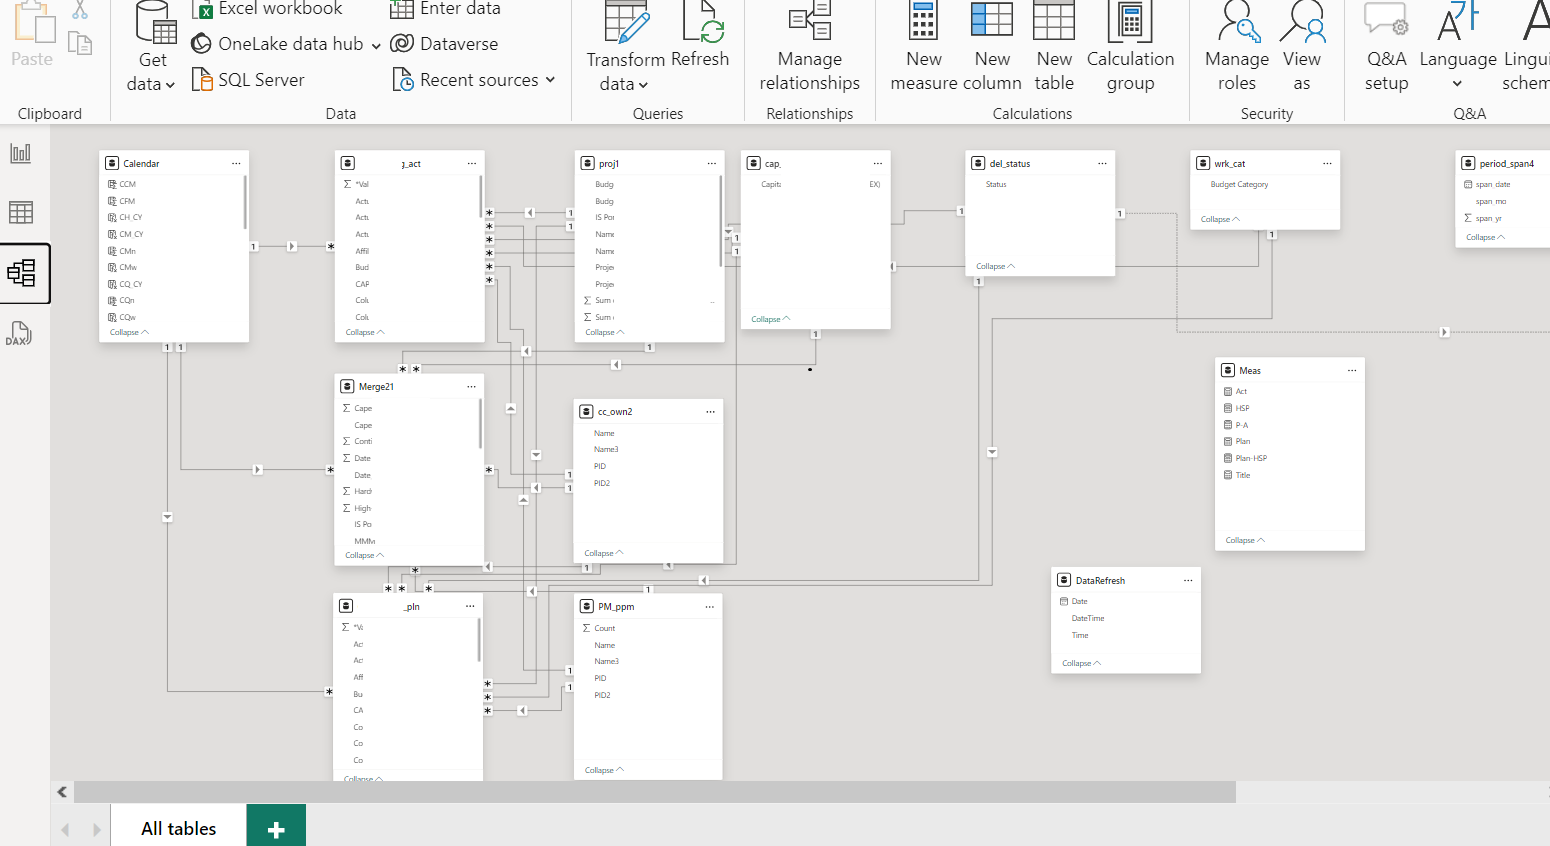
*2-6
The data model:
Dates, periods between tables are tied via the Calendar table, dimensions are loaded as standalone tables, and we will use them as slicers. Last refresh and calendar bounds are added as reference query, table. For a refresher on calendar, last refresh, etc/, check the basics toolbox chapter (bakers dozen chapter, housekeeping).
Part 3
Housekeeping, checks (spot and sanity). Communication (publish, share, updates)
3-1 Update (should turn into a second nature).
3-2 Check-list if any customer, user requirements are still due or incomplete, or not working
3-3 Spot check each visual
3-4 Take out, add-back a measure to a visual which doesn’t behave as intended.
3-5 Check cross filtering between page visuals
3-6 Update (natural now)
3-7 Publish (if applicable)
In Steps:
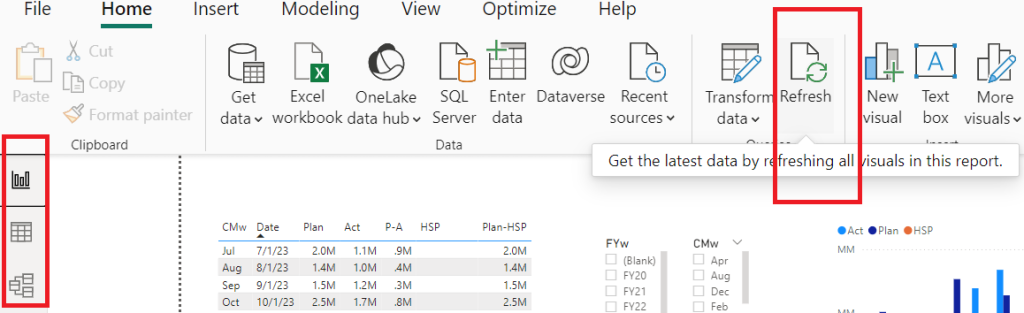
*3-1
Refresh – in each of the report, table, model views:
*3-2 Check-list for leftovers, turns out we need to:
-1 Project name as a searchable slicer (late)
-2 Additional slicers to toggle project and divisional managers – e.g. for budget discussions and performance reviews.
-3 Title
In steps:
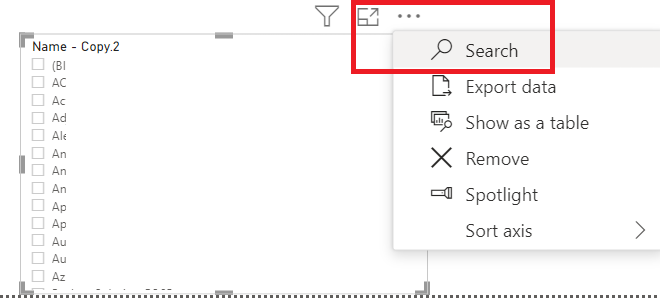
3-2-1: Pick slicer visual, search for the Project name column, measure. Enable search.
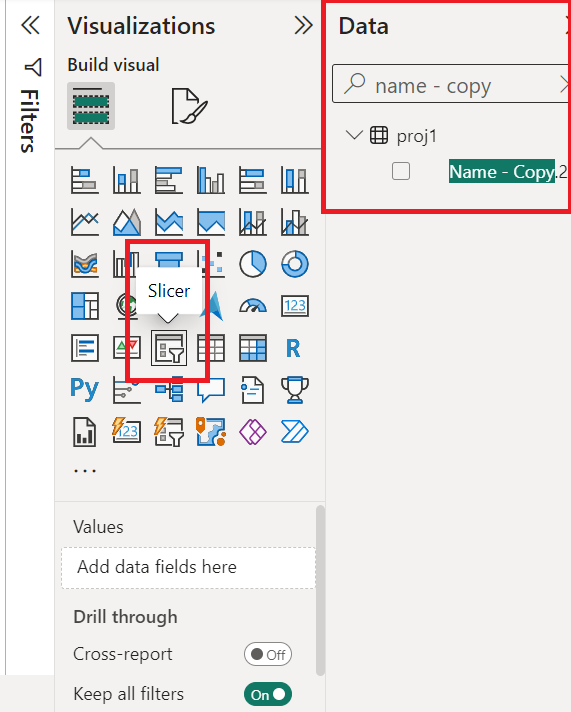
*
3-2-2: Pick two more slicer visual (PM, BO), search data for appropriate column, measures
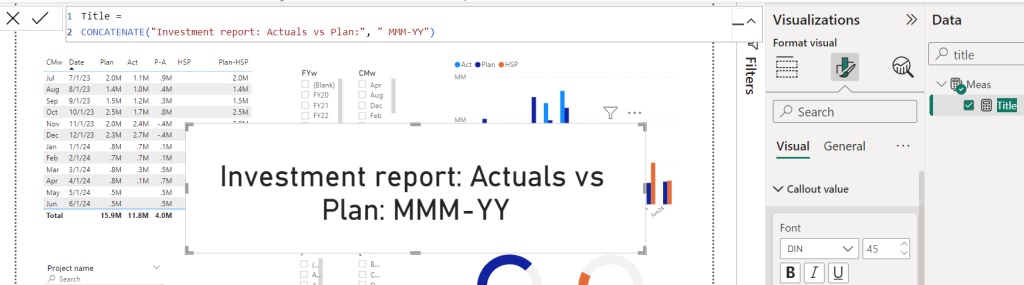
3-2-3: Title – convenient to have it in a measure (or variable) and up on a card visual. We trim size details to suit dashboard.
**Final draft (pre-release):
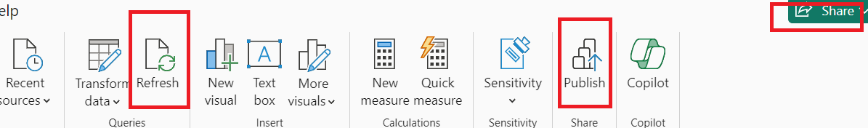
*3-6, *3-7 Refresh and Publish / Share (if applicable):
Chapter summary:
We’ve just done a complete Power BI dashboard to report investment volume (Capex/Cash) by actuals versus plan. We located the raw source data, then we processed it, then transformed and loaded it into the Power BI (desktop). Then we put together the data model to link the various tables – fact (transactional), dimensions, reference, and set relationships. Ultimately we laid out the few visuals we need to support the task concept – e/g/ to inform upcoming budget cycle and trace performance reviews.
In the next chapter we will look at a few tools we just used here – e.g. calendar table, visuals details, power query prep work on the sources, and why are those useful.
Comments are closed